Survey Results: California Bench Growing More Diverse
For the 16th straight year, California’s judicial bench has grown more diverse, according to new data released by the Judicial Council.
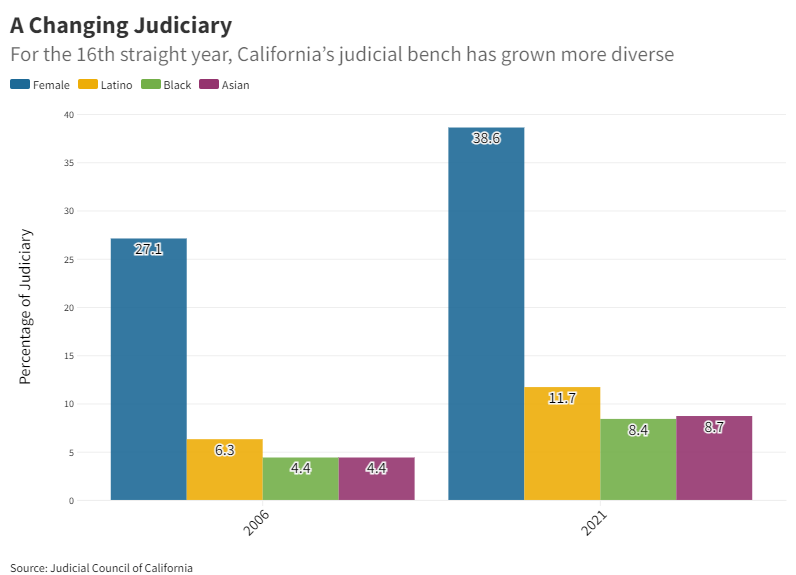
As of December 31, 2021, female judicial officers constitute 38.6% of judicial officers across all court levels, a 1% increase over the prior year and an increase of more than 11 percentage points since 2006—the first year that data were collected for this purpose.
The bench also has continued to become more racially and ethnically diverse. The proportion of white judicial officers has declined 7% since 2006. The percentage of Asian, Black, and Hispanic judicial officers has nearly doubled over the same time period, and now 35% of current justices and judges identify as non-white.
Statewide, Multi-Branch Effort to Increase Judicial Diversity
The Judicial Council developed a Judicial Diversity Toolkit, which encourages courts to reach out to underrepresented groups—which include individuals with diverse racial and ethnic backgrounds, disabilities, and sexual orientations—to educate and advise them about pursuing careers in the law.
In addition, Gov. Newsom last July announced the California Judicial Mentor Program as a statewide undertaking between the executive and judicial branches to develop and recruit qualified and diverse judicial applicants for the state’s superior and appellate courts.
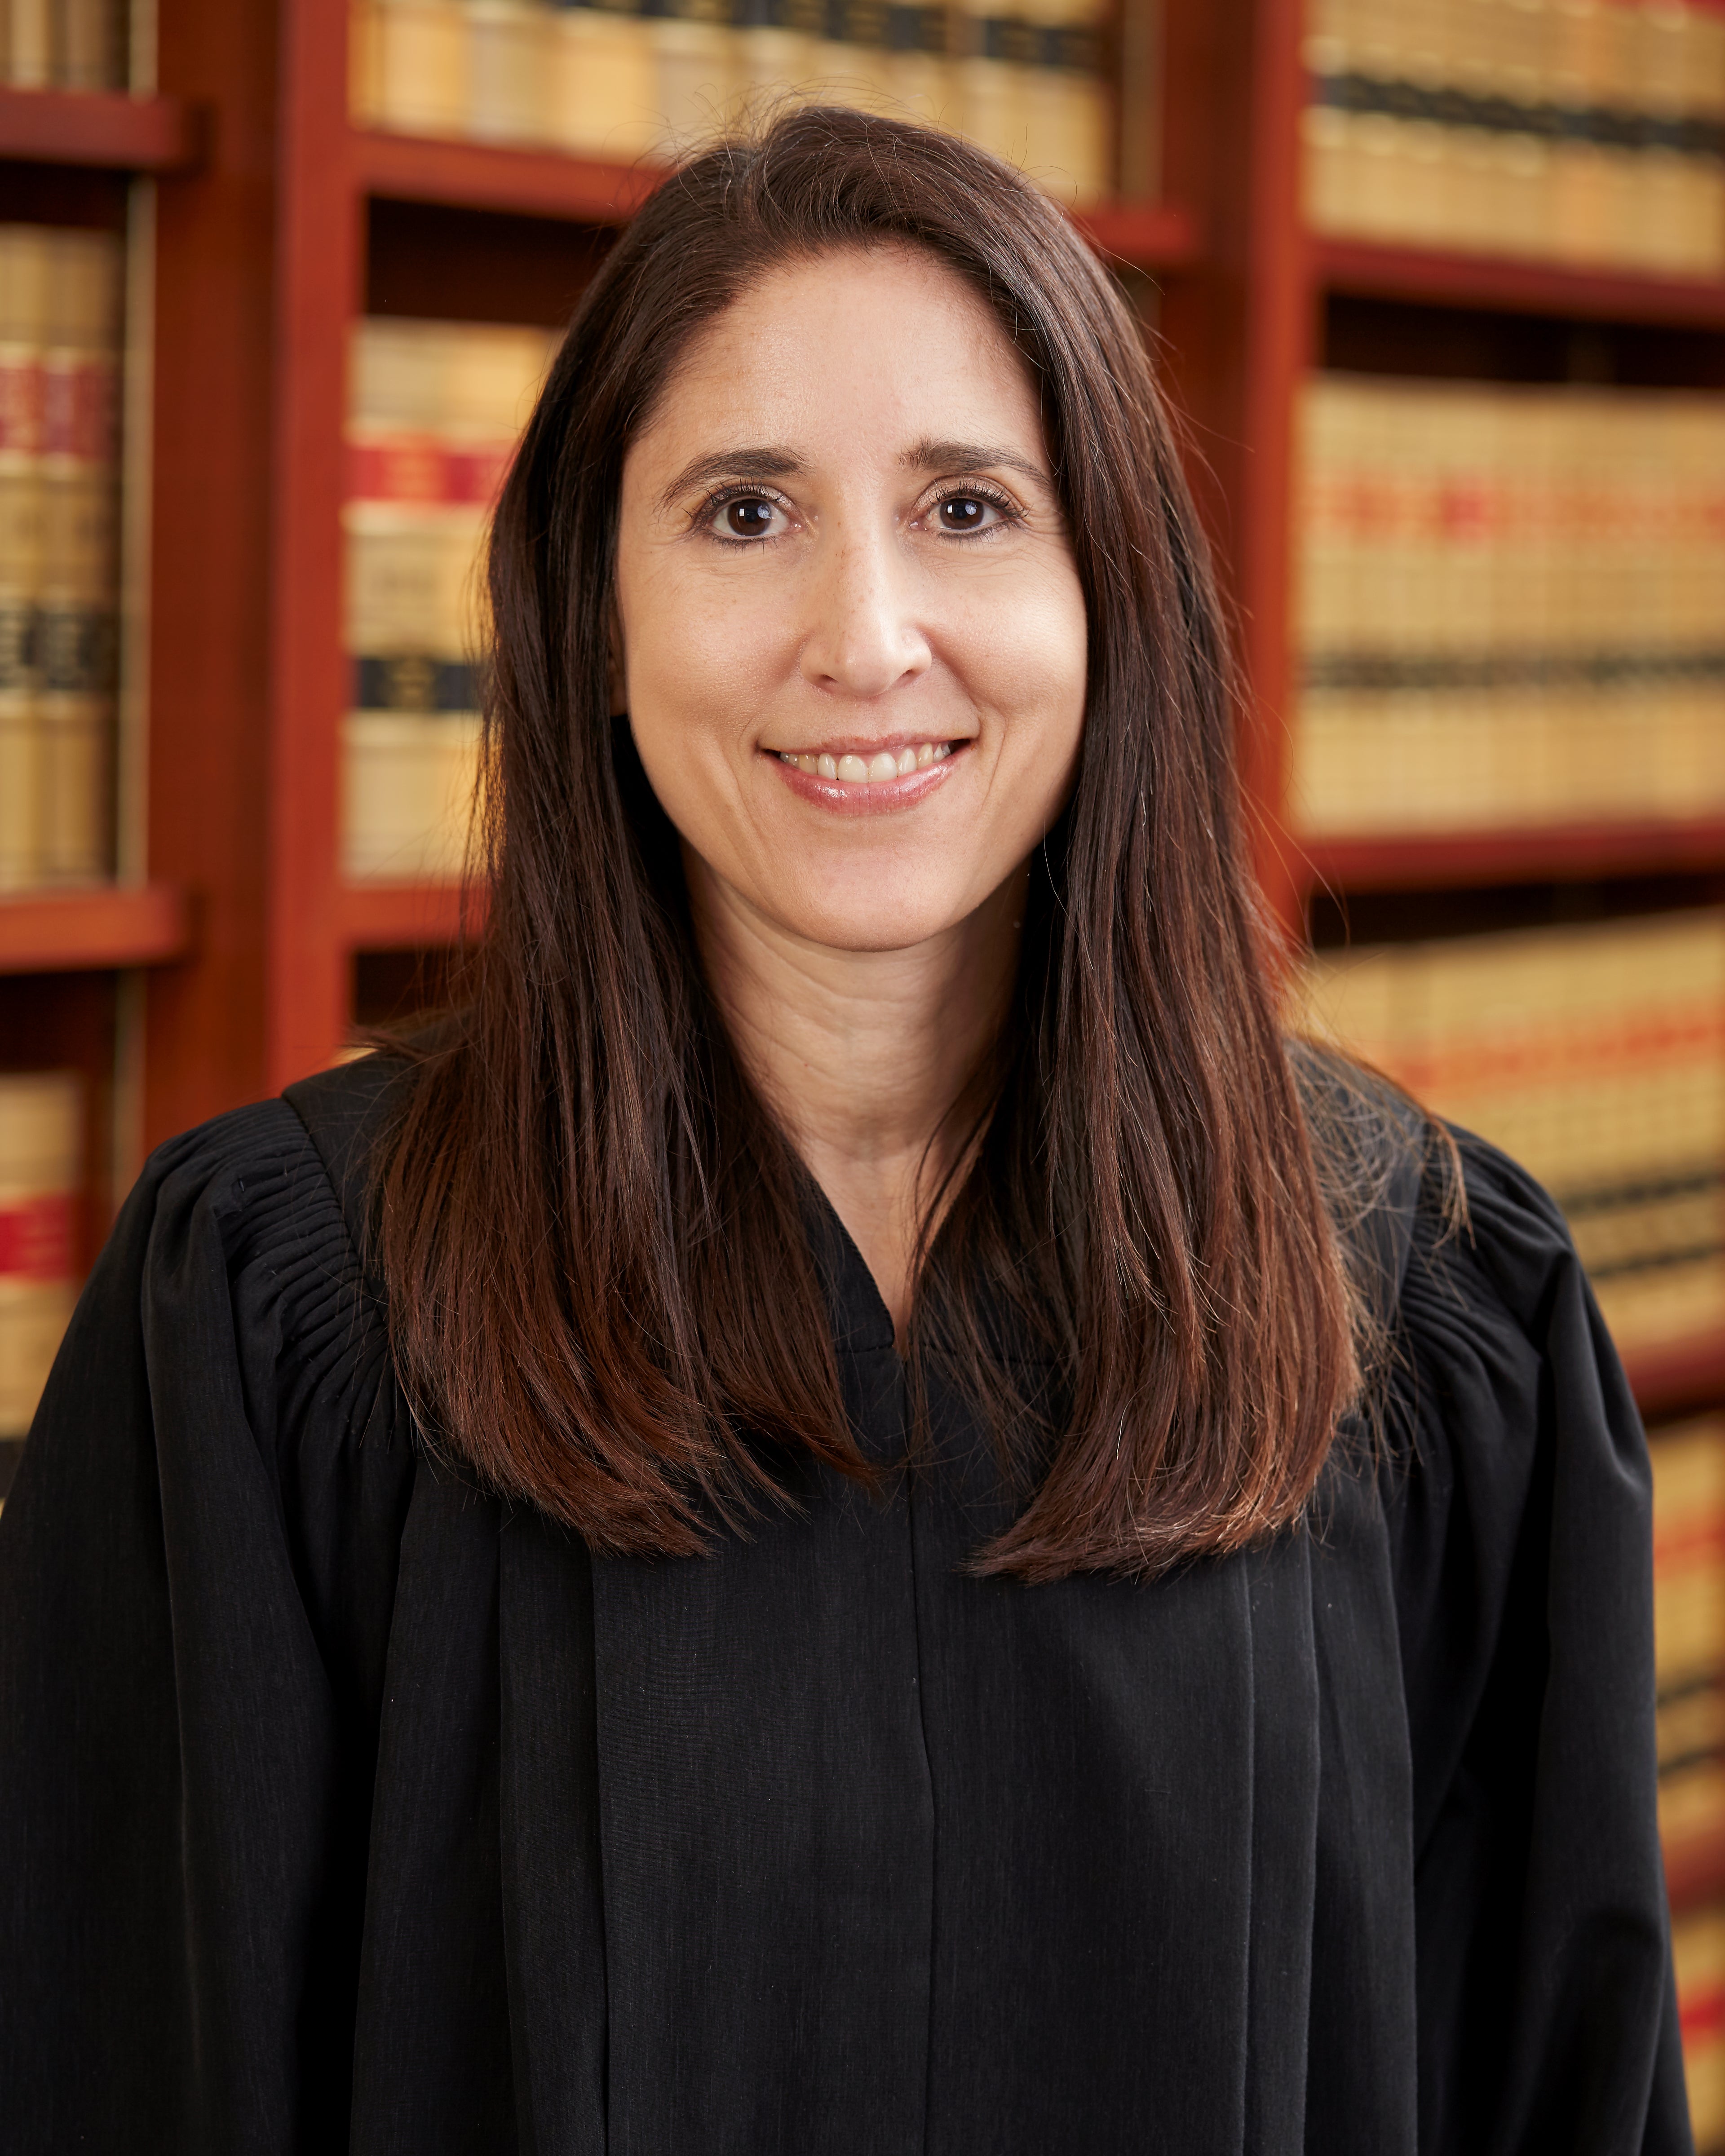
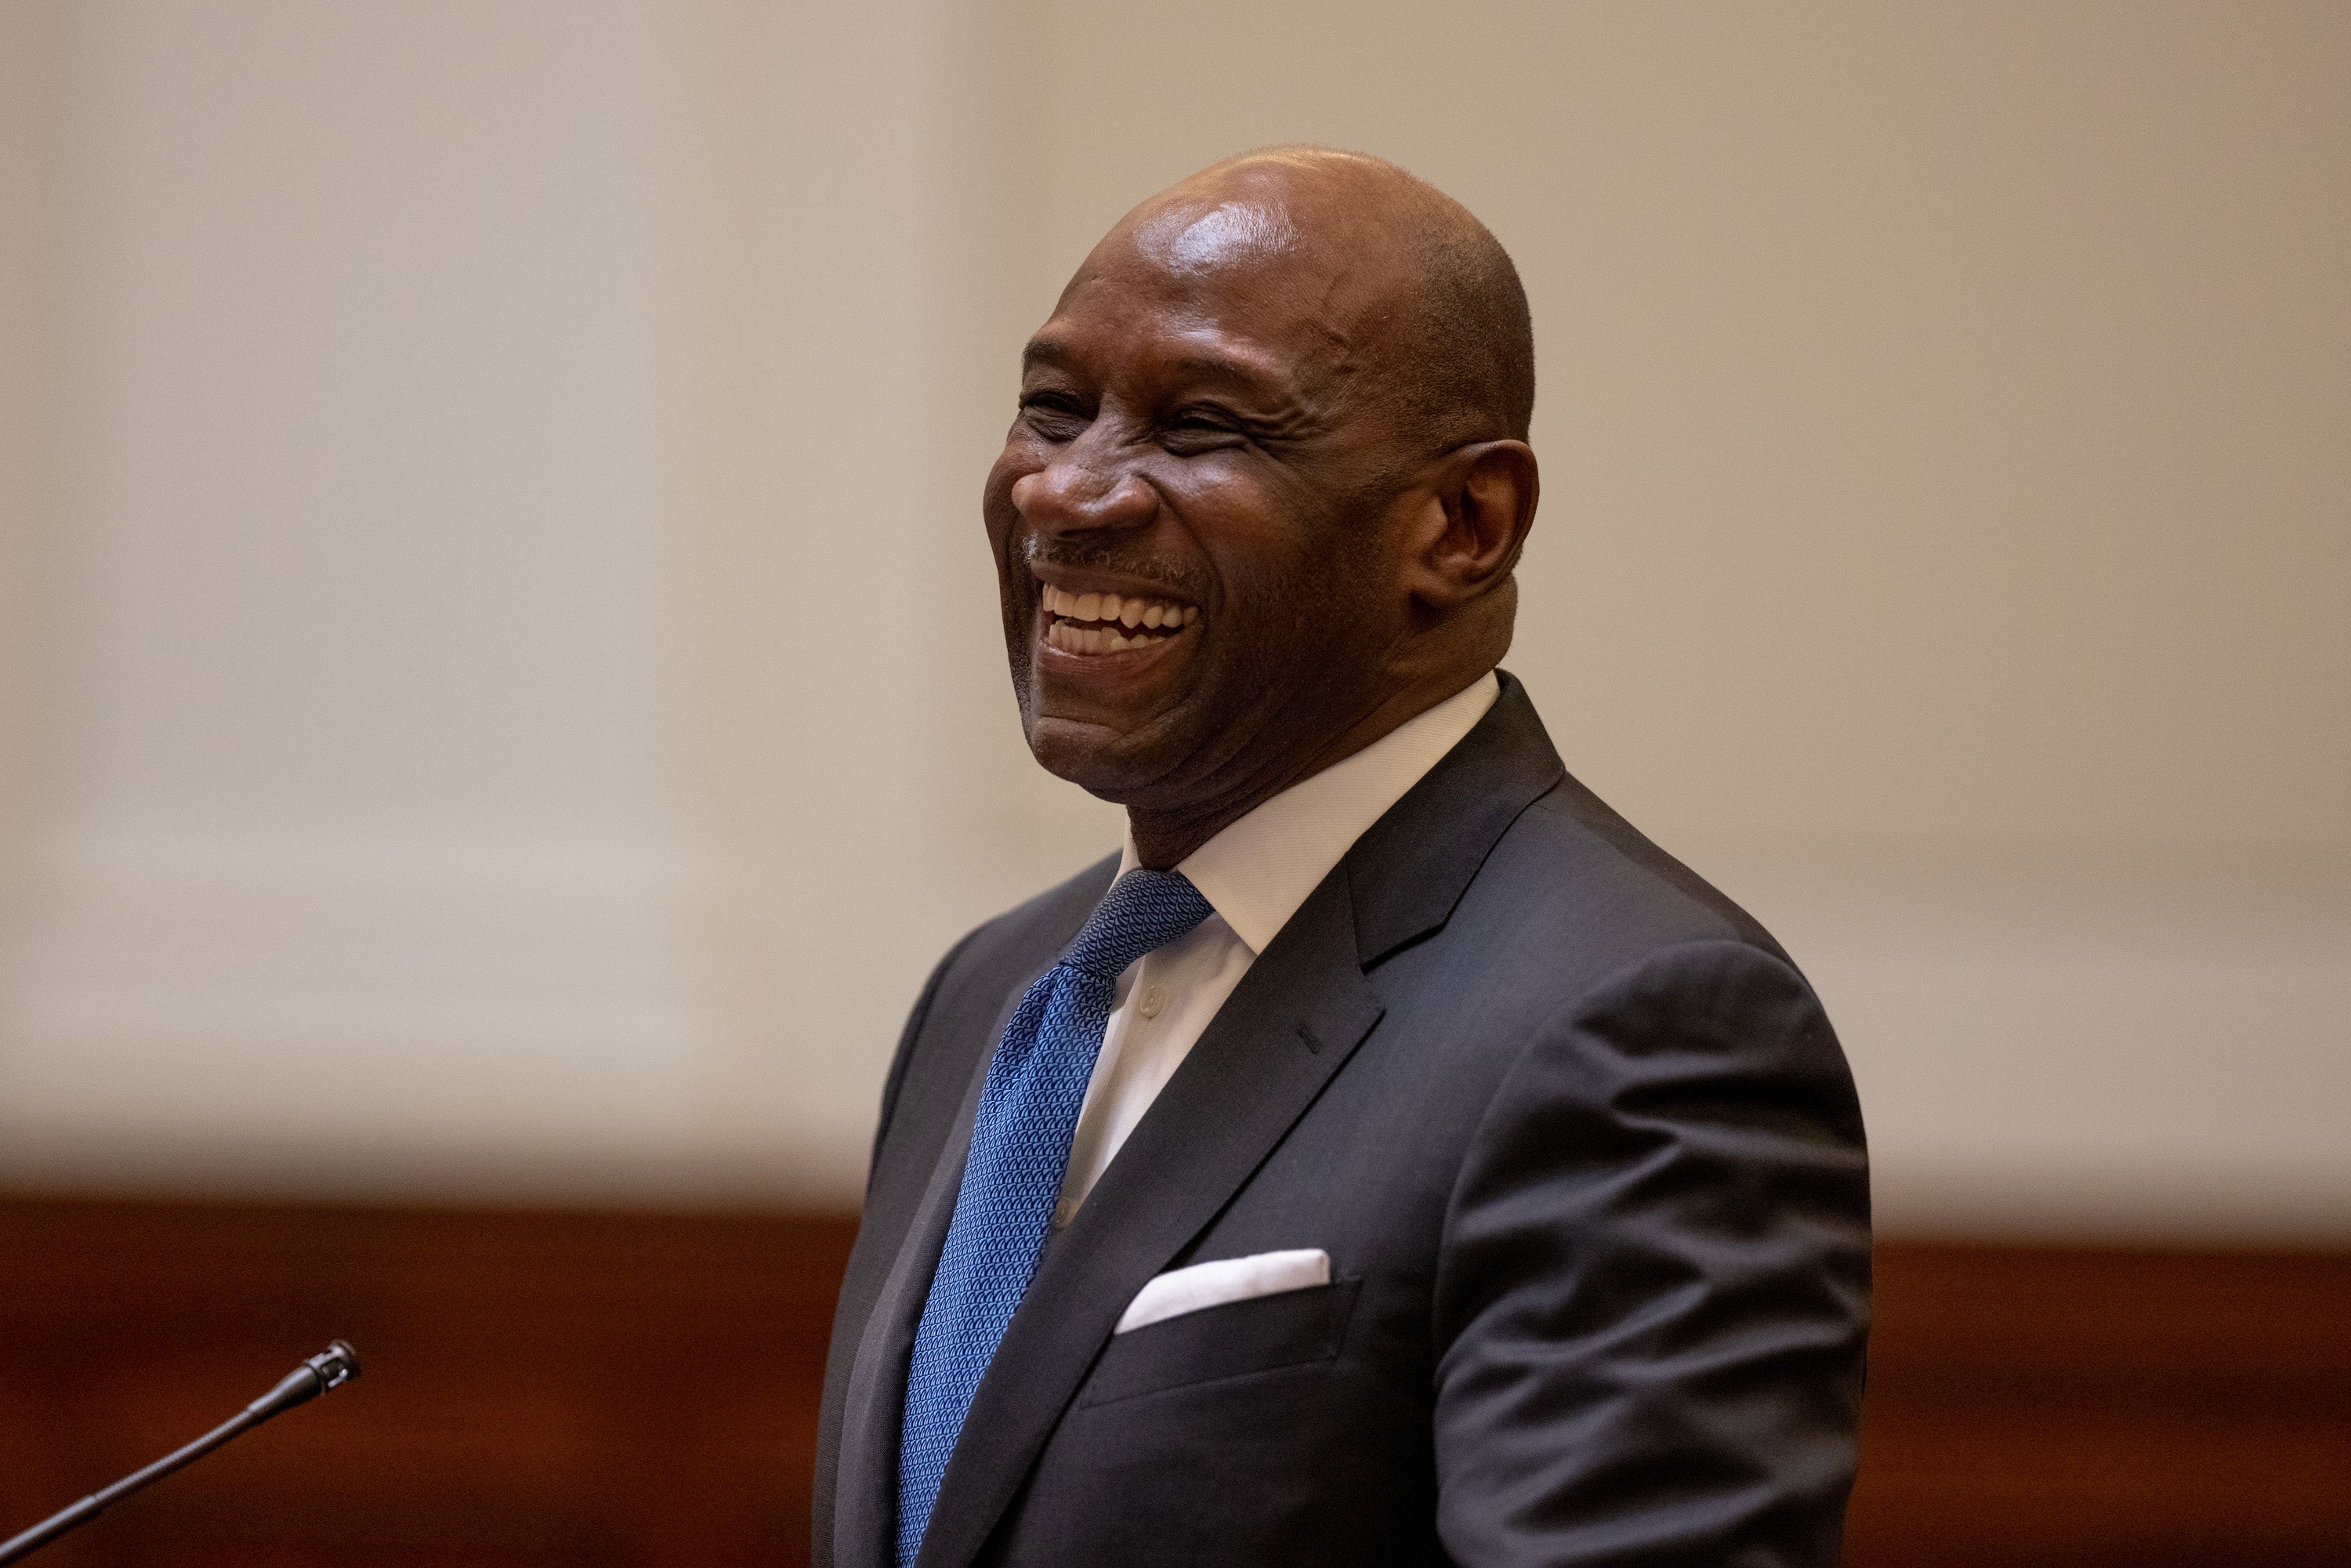
Of Governor Newsom’s 169 appointments during his first three years in office, 49% were women and 58% identified themselves as Asian, Black or African-American, Hispanic, or Native Hawaiian or other Pacific Islander. Governor Newsom recently nominated Justice Patricia Guerrero to the California Supreme Court, who if confirmed would become the court’s first Latina justice. Newsom also appointed Justice Martin Jenkins two years ago to the California Supreme Court, the court's first openly gay justice and third African American man ever to serve on the state’s highest court.
Survey of California Bench
The Judicial Council surveyed California judges and justices in December 2021 to get a snapshot of the demographics of the California bench—including gender, ethnicity, and sexual orientation. Responding to the questionnaire is voluntary for judges, and the data only reflects the responses provided.
Gender
Data show the percentage of female justices and judges has increased to 38.6%, compared to 27.1% in 2006, continuing a steady upward trend.
Race and Ethnicity
The data also show changes over the past 16 years in the percentage of justices and judges reported in the following race/ethnicity categories:
- American Indian or Alaska Native (.5% in 2021 compared to 0.1% in 2006);
- Asian (8.7% in 2021 compared to 4.4% in 2006);
- Black or African American (8.4% in 2021 compared to 4.4% in 2006);
- Hispanic or Latino (11.7% in 2021 compared to 6.3% in 2006);
- Pacific Islander (0.3% in 2021 compared to 0.1% in 2006);
- White (63.1% in 2021 compared to 70.1% in 2006);
- Some Other Race (1.0% in 2021 compared to 0.2% in 2006);
- More Than One Race (4.4% in 2021 and also 4.4% in 2006); and
- Information Not Provided (1.9% in 2021 compared to 9.9% in 2006).
These changes reflect judicial retirements and other departures from the bench, new judicial appointments, and an increase in the number of trial court judges who voluntarily provided race/ethnicity information.
Gender Identity/Sexual Orientation
This is the 11th year that the study includes data on gender identity and sexual orientation, as required by a law passed in 2011. Of the respondents who provided information about gender identity/sexual orientation, the following identified as:
- Heterosexual - 73.9%
- Lesbian - 1.8%
- Gay - 2.3%
- Bisexual - 0.2%
- Transgender - 0.1%
- Information not provided - 21.7%
Veteran and Disability Status
In addition, this is the 8th year that the study includes data on veteran and disability status. These questions were first asked of justices and judges who were new to the bench during the 2014 calendar year, although judges appointed before this date are free to update this aspect of their demographic profile as well. Of the 707 active trial court judges responding to the question about their status as a veteran, 50 respondents (7%) indicated they have served in the military. Of the 744 active judges responding to the question concerning their disability status, 17 judges (2%) indicated they have a disability.
About Judicial Officer Demographic Data
Government Code section 12011.5(n) requires the Judicial Council to collect and release aggregate demographic data on California state justices and judges by March 1 every year. This is the report’s 16th year.
Increasing the diversity of California’s judicial officers to reflect the rich diversity of California’s populace continues to be a key goal of the Judicial Council.
Images