Survey Results: California Bench Growing More Diverse
For the 15th straight year, California’s judicial bench has grown more diverse, according to new data released by the Judicial Council.
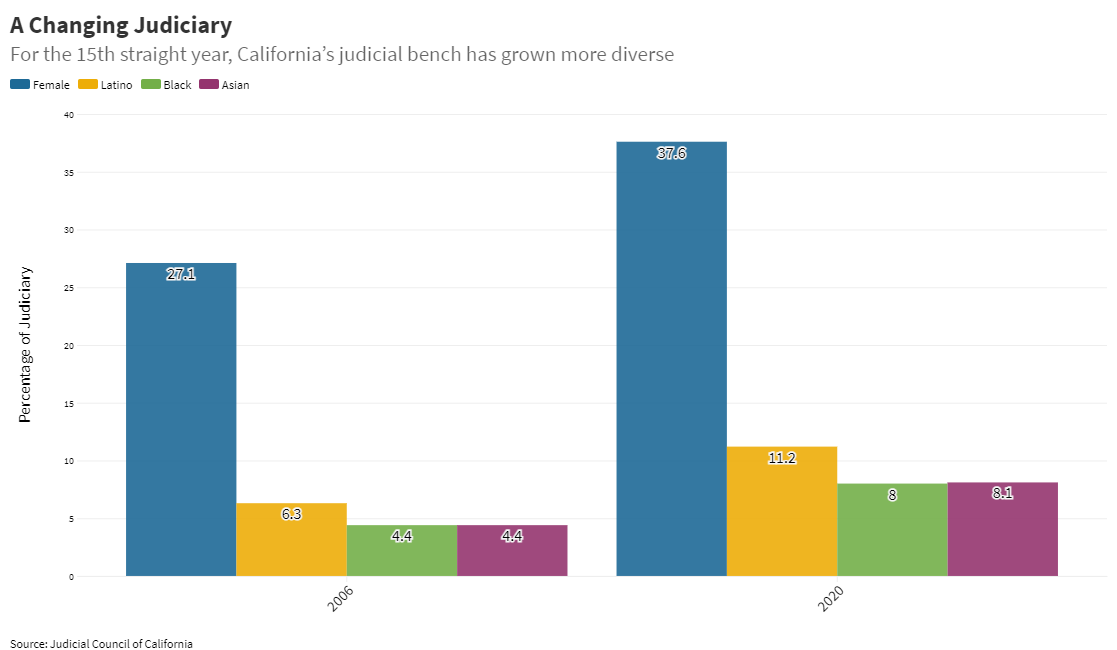
As of December 31, 2020, female judicial officers constitute 37.6% of judicial officers across all court levels, a slight increase over the prior year and an increase of more than 10 percentage points since 2006—the first year that data were collected for this purpose.
The bench also has continued to become more racially and ethnically diverse. The proportion of white judicial officers has declined about 5 percentage points since 2006, while the percentage of Asian, Black, and Hispanic judicial officers has nearly doubled over the same time period.
“As the first Asian-Filipina American and the second woman to serve as the state’s chief justice, I’m pleased that California’s judiciary continues to grow more diverse,” said Chief Justice Tani Cantil-Sakauye. “Thanks in large part to recent appointments from Governor Gavin Newsom and his predecessor Governor Jerry Brown, our courts are more reflective of the rich tapestry of people we serve.”
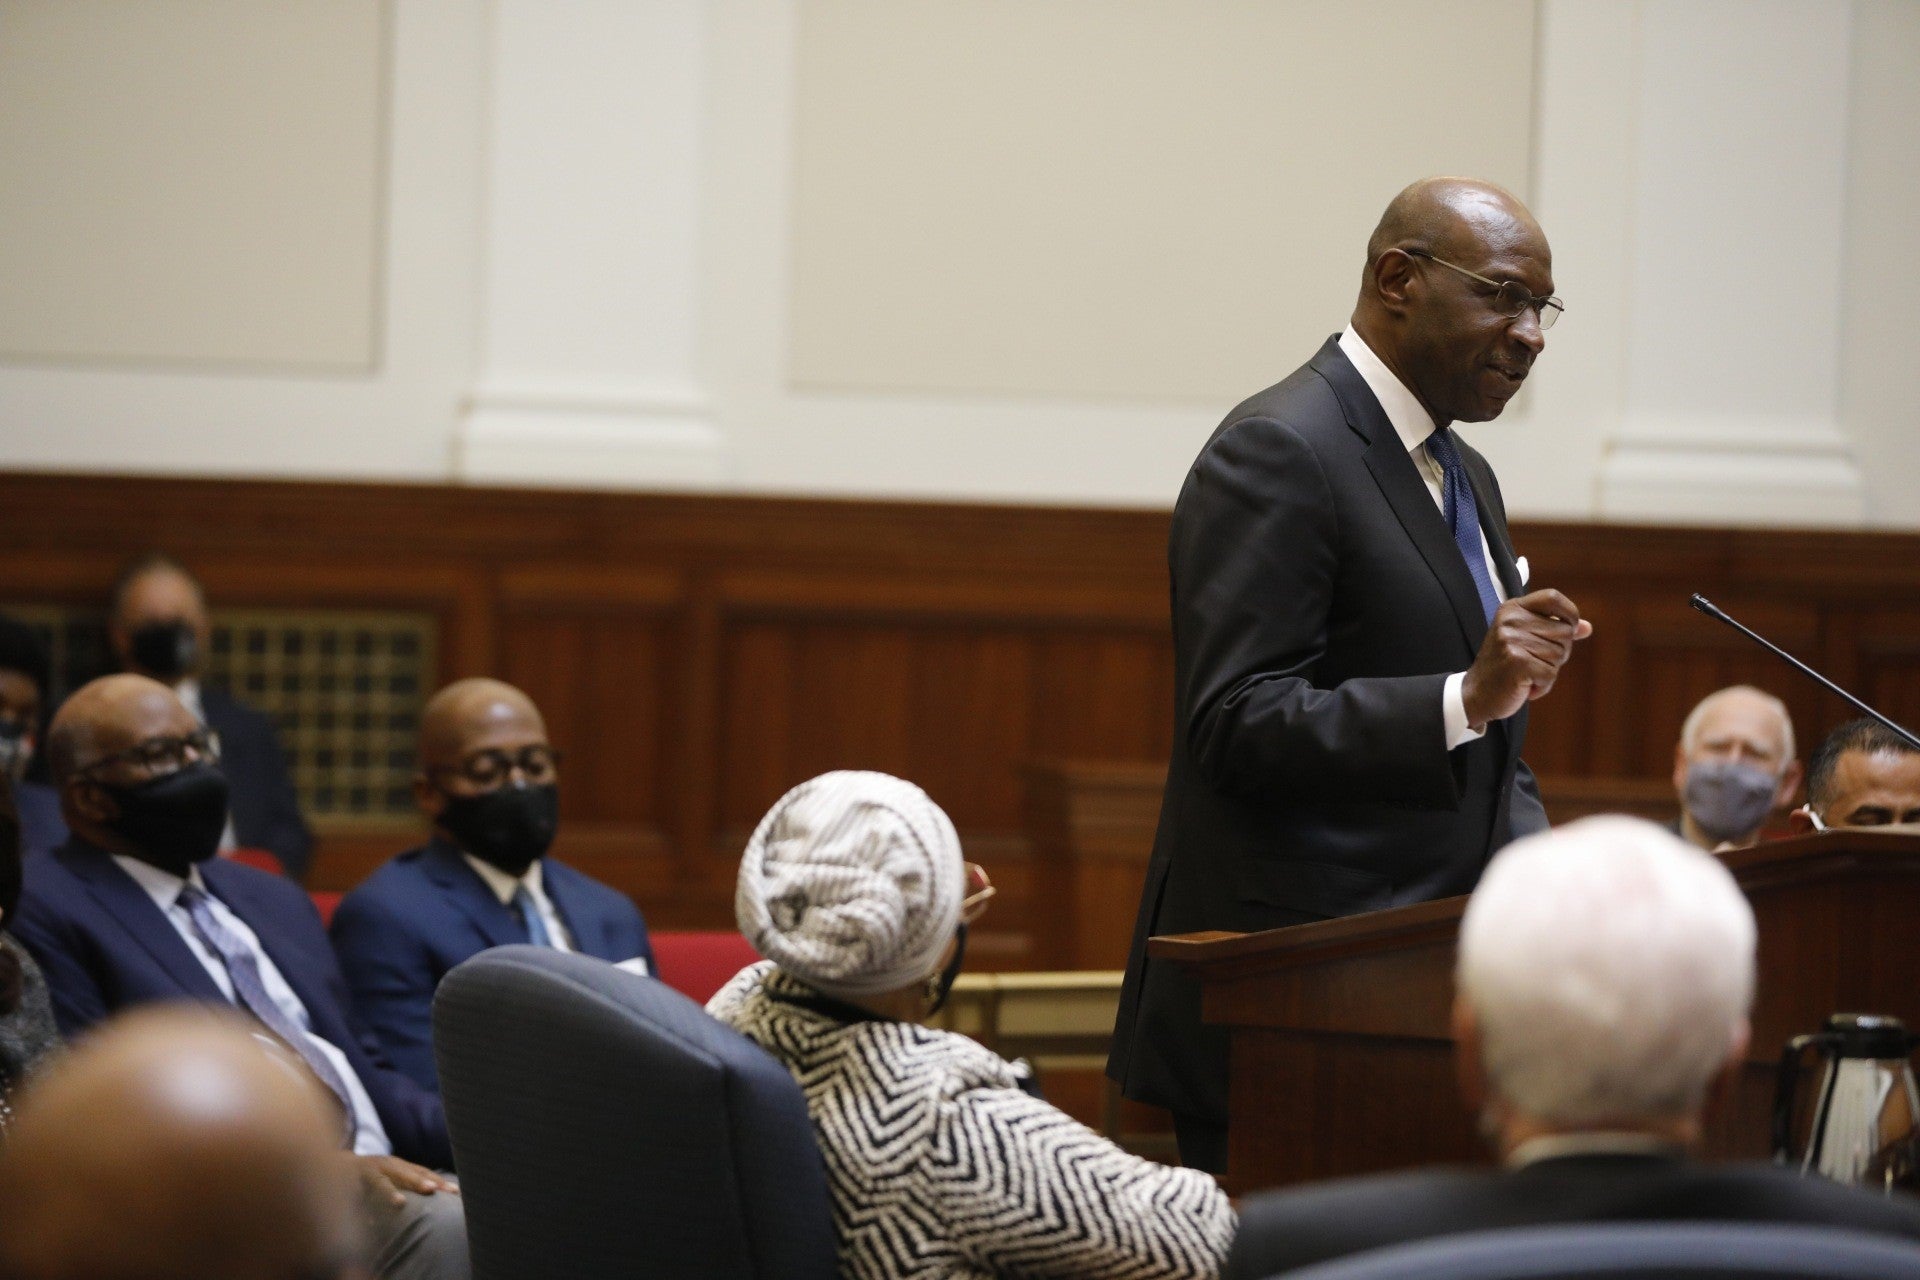
In Governor Brown’s final year in office women accounted for more than half of judicial appointees and 41% identified as non-white. Of Governor Newsom’s 78 appointments during his first two years in office, half were women and more than half identified themselves as Asian, Black or African-American, Hispanic, or Native Hawaiian or other Pacific Islander. Governor Newsom appointed Justice Martin Jenkins last year to the California Supreme Court, the court's first openly gay justice and third African American man ever to serve on the state’s highest court.
Survey of California Bench
The Judicial Council surveyed California judges and justices in December 2020 to get a snapshot of the demographics of the California bench—including gender, ethnicity, and sexual orientation. Responding to the questionnaire is voluntary for judges, and the data only reflects the responses provided.
Among the findings:
Gender
Data show the percentage of female justices and judges has increased to 37.6%, compared to 27.1% in 2006, continuing a steady upward trend.
Race and Ethnicity
The data also show changes over the past 15 years in the percentage of justices and judges reported in the following race/ethnicity categories:
- American Indian or Alaska Native (0.4% in 2020 compared to 0.1% in 2006);
- Asian (8.1% in 2020 compared to 4.4% in 2006);
- Black or African American (8.0% in 2020 compared to 4.4% in 2006);
- Hispanic or Latino (11.2% in 2020 compared to 6.3% in 2006);
- Pacific Islander (0.3% in 2020 compared to 0.1% in 2006);
- White (64.8% in 2020 compared to 70.1% in 2006);
- Some Other Race (1.0% in 2020 compared to 0.2% in 2006);
- More Than One Race (4.2% in 2020 compared to 4.4% in 2006); and
- Information Not Provided (1.9% in 2020 compared to 9.9% in 2006).
These changes reflect judicial retirements and other departures from the bench, new judicial appointments, and an increase in the number of trial court judges who voluntarily provided race/ethnicity information.
Gender Identity/Sexual Orientation
This is the 10th year that the study includes data on gender identity and sexual orientation, as required by a law passed in 2011. More than 70% of respondents provided information about gender identity/sexual orientation, reporting the following:
- Heterosexual, 72.9%;
- Lesbian, 1.6%;
- Gay, 2.2%;
- Bisexual, 0.2%;
- Transgender, 0.1%; and
- Information not provided, 23.1%.
Veteran and Disability Status
In addition, this is the 7th year that the study includes data on veteran and disability status. These questions were first asked of justices and judges who were new to the bench during the 2014 calendar year, although judges appointed before this date are free to update this aspect of their demographic profile as well. Of the 667 active trial court judges responding to the question about their status as a veteran, 46 respondents (7%) indicated they have served in the military. Of the 672 active judges responding to the question concerning their disability status, 17 judges (3%) indicated they have a disability.
About Judicial Officer Demographic Data
Government Code section 12011.5(n) requires the Judicial Council to collect and release aggregate demographic data on California state justices and judges by March 1 every year. This is the report’s 15th year.
Increasing the diversity of California’s judicial officers to reflect the rich diversity of California’s populace continues to be a key goal of the Judicial Council.
Images