Survey: California Bench Continues to Grow More Diverse
For the 12th straight year, California’s judicial bench has grown more diverse, according to new data released by the Judicial Council.
Gov. Jerry Brown's recent judicial appointments have contributed to this increase: between 2011 and 2017, women accounted for more than half of Brown’s appointees, and 40% identified as non-white.
The Judicial Council surveyed California judges and justices in December 2017 to get a snapshot of the demographics of the California bench—including gender, ethnicity, and sexual orientation. Responding to the questionnaire is voluntary for judges, and the data only reflects the responses provided.
Among the findings:
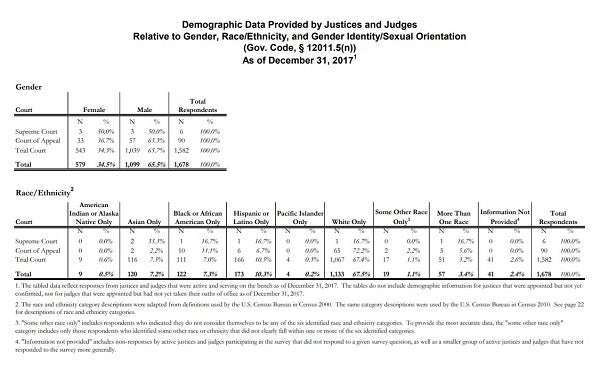
Gender
Women now represent 35% of superior court judges, compared to 27% in 2006, continuing a steady upward trend.
Race and Ethnicity
Approximately 98% of respondents provided information about race/ethnicity, and the data show an increase in the percentage of justices and judges in all categories other than white:
- American Indian or Alaska Native (0.5% in 2017 compared to 0.1% in 2006);
- Asian (7.2% in 2017 compared to 4.4% in 2006);
- Black or African American (7.3% in 2017 compared to 4.4% in 2006);
- Hispanic or Latino (10.3% in 2017 compared to 6.3% in 2006);
- Pacific Islander (0.2% in 2017 compared to 0.1% in 2006);
- White (67.5% in 2017 compared to 70.1% in 2006);
- Some Other Race (1.1% in 2017 compared to 0.2% in 2006); and
- More Than One Race (3.4% in 2017 compared to 4.4% in 2006)
Gender Identity/Sexual Orientation
This is the 7th year that the study includes data on gender identity and sexual orientation. More than 70% of respondents provided information about gender identity/sexual orientation, reporting the following:
- Heterosexual, 67.4%;
- Lesbian, 1.3%;
- Gay, 1.7%;
- Bisexual, 0.1%; and
- Transgender, 0.1%
Veteran and Disability Status
In addition, this is the 4th year that the study includes data on veteran and disability status. Of the 435 trial court judges responding to the question about their status as a veteran, 36 respondents (8%) indicated they have served in the military. Of the 439 judges responding to the question concerning their disability status, 11 judges (3%) indicated they have a disability.
About Judicial Officer Demographic Data
Government Code section 12011.5(n) requires the Judicial Council to collect and release aggregate demographic data on California state justices and judges by March 1 every year. This is the 12th year that the information has been collected and released.
Increasing the diversity of California’s judicial officers to reflect the rich diversity of California’s populace continues to be a key goal of the Judicial Council.
Images